
Master Class

Steve Franconeri
Professor of Psychology in the Weinberg College of Arts & Sciences, Northwestern Professor of Marketing, Kellogg (Courtesy)
How visualizations can help you find answers and persuade others
Lessons from Visualization for Persuasion course
There's a reason our eyes glaze over when we stare at a screenful of numbers.
Nearly half of the human brain is devoted to the visual system, explains Steve Franconeri, a professor of psychology with a courtesy appointment at Kellogg. Humans evolved to process enormous amounts of information about colors, shapes and patterns in a split second.
Yet all too often, these powerful visual machines end up being underutilized. When we encounter a problem in business, for example, we typically turn to stiff spreadsheets and statistics.
Franconeri thinks that's a mistake. "You should be using your visual system to look for the underlying story behind these numbers," he says.
In his course "Visualization for Persuasion," Franconeri shows Kellogg students how to do just that. By carefully leveraging the visual brainpower we all share, he argues, you can not only draw smarter conclusions, but more easily persuade others to see things your way.
To fully understand your data, you have to see it
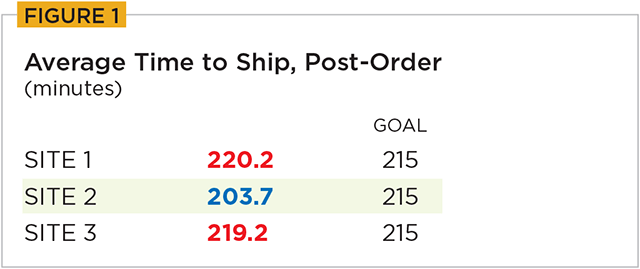
Franconeri describes a hypothetical company that aims to keep shipping times under 215 minutes. To find out which sites across the company are meeting that goal, an executive may consider average shipping times, as summarized in Figure 1. "People look at benchmarks like this and say, 'Oh, Site 2 is on time, but Site 1 is lagging,'" Franconeri says. But is there more to the story?
As Franconeri explains, averages are useful because they boil complex data down to one digestible statistic. "But they do that by making assumptions about what the underlying data look like," he says. "If you want to see whether those assumptions are true, you need to use your more powerful visual system."
"You should be using your visual system to look for the underlying story behind these numbers."
When we show the same data in graphic form, a very different picture emerges (see Figure 2).
Contrary to what the averages suggested, we now see that Site 1 actually tends to ship slightly faster than Site 2. Furthermore, the graphs help us see why the averages were so misleading: the bizarre outliers at Sites 1 and 2.
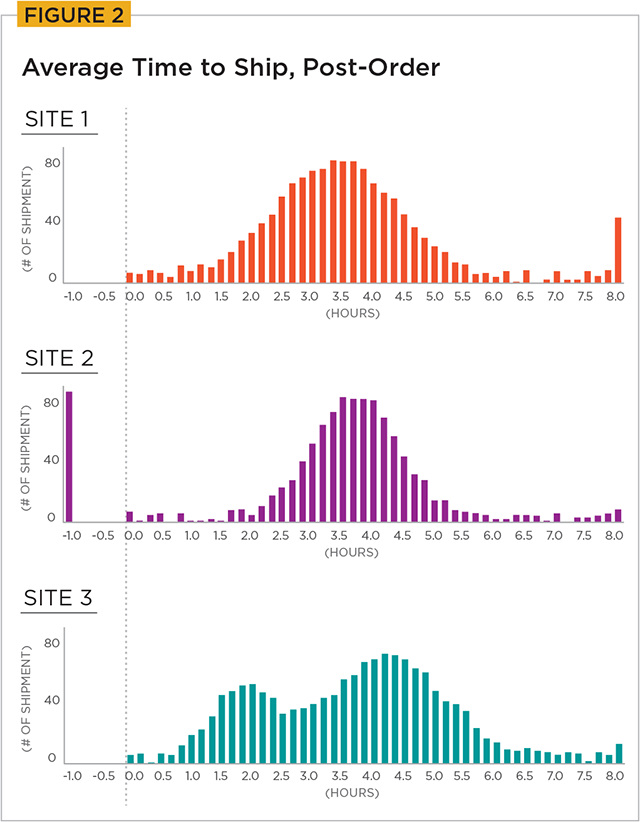
"It turns out that Site 1 has been using an internal code of '+8 hours' to indicate that a product was shipped the next day," Franconeri says, "and Site 2 is using '-1 hour' to indicate that an order was cancelled before it was shipped." (While this example is hypothetical, he estimates that a quarter of datasets have hidden quirks like these.)
Meanwhile, Site 3 appears to have two different peaks, rather than just one. If the executive wants to reduce shipping times, Franconeri explains, she should investigate what's behind this pattern. "Maybe there are two different managers on duty," he says, "or maybe there are two different types of products that they ship."
The takeaway: By fixating on averages, the executive would have missed what was really happening at each site. "Unless you visualize the data, you'll never see it," he says.
Help others see what you see
Imagine that you're giving a presentation about income sources among senior citizens. You might be tempted to present something like Figure 3 below.
But this is actually a highly inefficient graphic, Franconeri warns. Because charts present so much information at once, badly designed ones fail to show the viewer where to focus. "In this example, there are many different comparisons and patterns that your eyes could be picking out right now," he says.
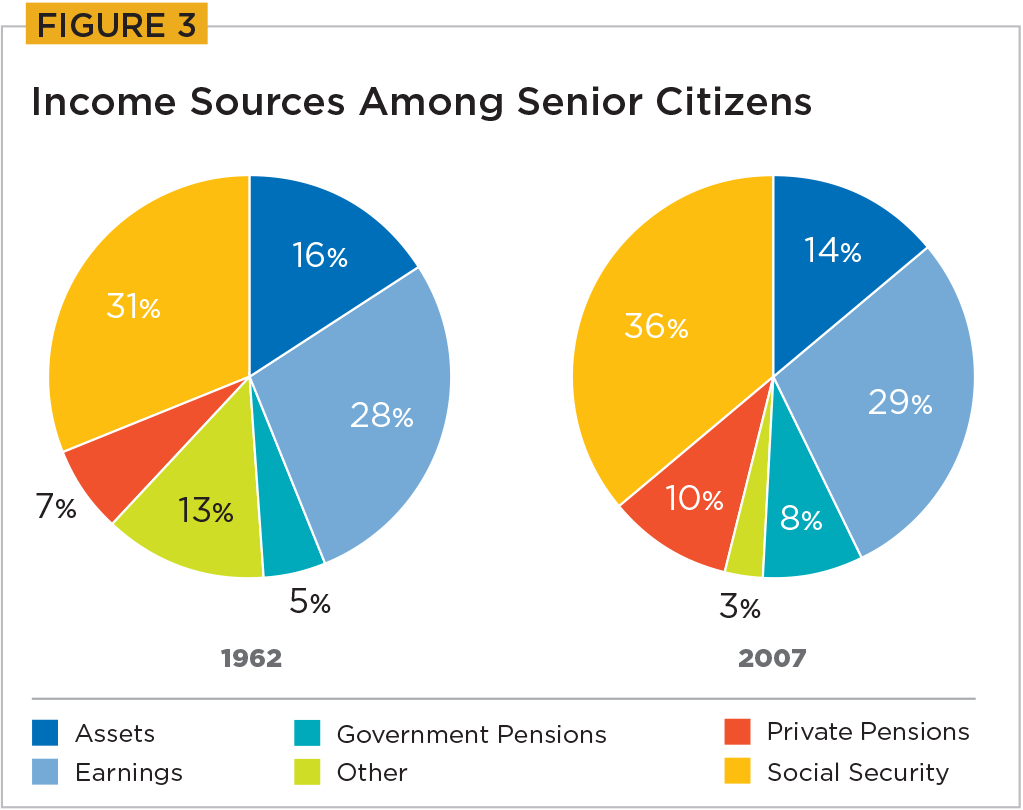
Try using this visualization to answer a question: How did income from pension sources change between 1962 and 2007? "It takes you several seconds to find the correct values on the left, find the correct values on the right, and compare each pair," Franconeri says.
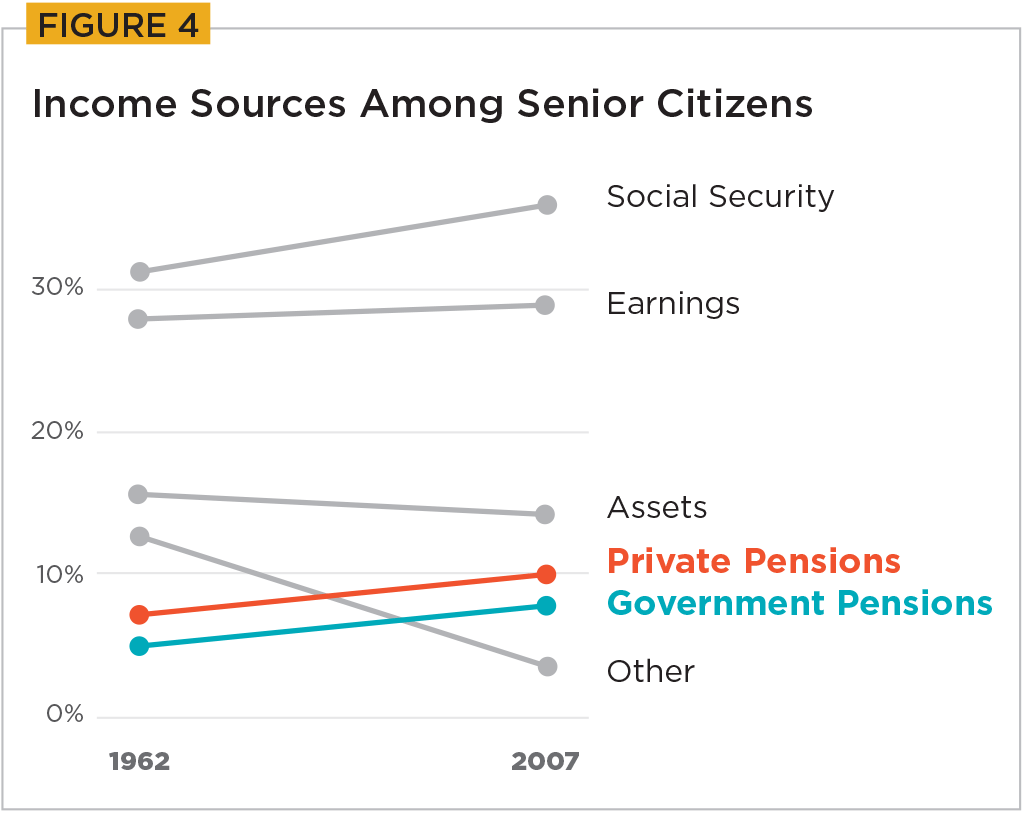
But a different format can let you answer the same question in a fraction of a second (see Figure 4).
Since each line is labelled directly, the eye no longer has to jump back and forth between the data and the legend. The graphic also uses color to highlight the relevant income sources (pensions), while the slope of the lines provides a rapid comparison between years.
"There are research-backed rules that can help you create a visualization that is clear and effective," Franconeri concludes. "If you don't follow them, then your visualization is going to be overly complex, inefficient, or even overwhelming."