Kellogg MBA employment outcomes

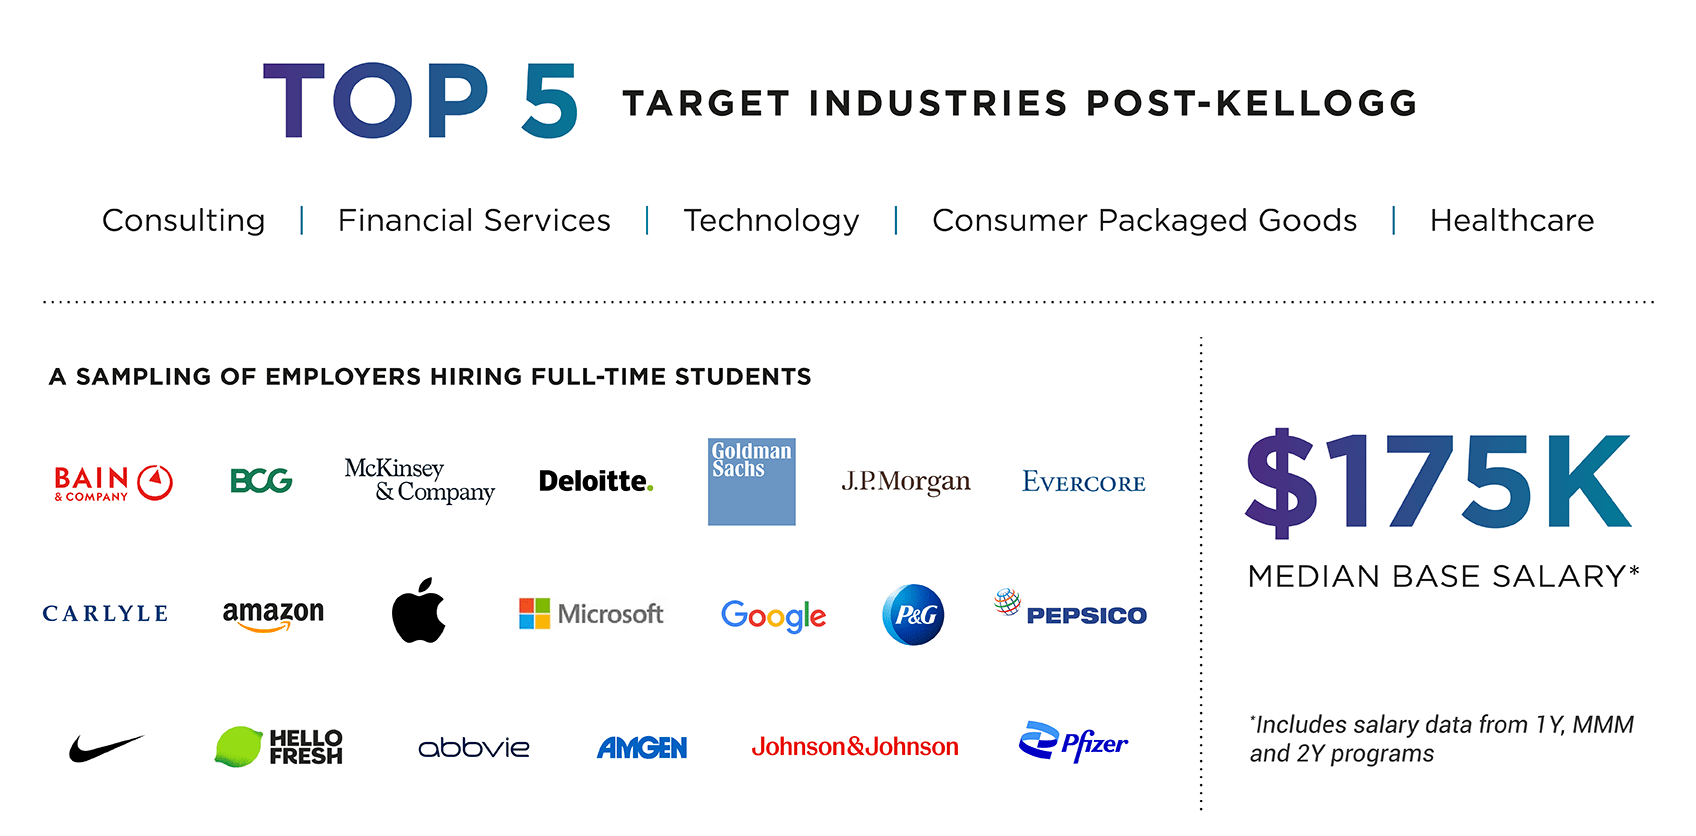
The employment outcomes for the Full-Time MBA class of 2023 continue to highlight the strong demand for Kellogg talent from a diverse range of employers that spans nearly every industry, including healthcare startups, tech, private equity firms, leading CPG companies and dozens of Fortune 500 corporations.
See Full-Time employment outcomes by program
Two-Year MBA
Our Two-Year MBA Program gives students the flexibility to explore a range of disciplines while developing management and leadership skills along the way.
Students graduating from the Two-Year Program were able to make career pivots into different industries, or even start their own ventures. We saw students pivot from management consulting to highly sought-after roles in tech and healthcare, and increased interest in professionals seeking finance roles in investment banking and private equity. Examples of roles accepted by our Two-Year MBA graduates include business program manager at Microsoft, associate at McKinsey & Company and assistant vice president of Impact Measurement at US Bank.
View the Two-Year MBA employment outcomes
One-Year MBA
The One-Year MBA Program is an accelerated option for candidates looking to deepen their business expertise and leadership within an already identified industry.
Key industries include tech, consulting, finance and consumer packaged goods. Many of this year’s graduates are taking on elevated roles within their pre-Kellogg industry, including go-to-market program manager at Google and vice president at Adams Street Partners.
View the One-Year MBA employment outcomes
MMM
The MMM Program is an immersive dual-degree program in partnership with the McCormick School of Engineering at Northwestern. Students receive a rigorous business education integrated with a strong foundation in design innovation. MMM graduates receive an MBA from Kellogg and an MS from McCormick.
Many of this year’s graduates secured roles with tech firms, including senior product manager at Amazon and Salesforce. Others landed in design and innovation teams within retail and consulting companies like Bose and Jump Associates, holding titles such as software product manager and senior innovation strategist.
View the MMM employment outcomes
MBAi
The MBAi Program is offered jointly with the McCormick School of Engineering. This AI-focused MBA is designed to give students the tools to unlock innovative business solutions through complex disciplines like machine learning, data science, artificial intelligence and computational thinking for business.
Graduates go on to secure roles at the cross-section of business and technology, with titles like product manager at Amazon and Adobe, and senior technical product manager at ServiceNow.
View the MBAi employment outcomes
Internship Outcomes
Students in the Two-Year, MMM and MBAi classes of 2024 completed internships in consulting (27%), technology (26%), and financial services (15%) among other industries. Leveraging Kellogg's strong relationships with our recruiting partners and alumni, students secured summer roles at companies such as Boston Consulting Group, Apple, Johnson & Johnson and Evercore Partners.
View the class of 2024 internship employment outcomes
Students graduating in the Full-Time Class of 2023
Class Profile
Demographics
Demographics, Full-Time Class of 2023
| Students graduating in the Full-Time Class of 2023 | 743 | |
| One-Year MBA students | 133 | |
| Two-Year MBA students | 501 | |
| MMM students* | 64 | |
| MBAi students | 45 | |
| Age range at graduation** | 25-39 | |
| Work experience range (middle 80%)** | 3.0-7.0 years | |
| Women** | 46% | |
| U.S. Minority** | 41% | |
| International citizenship** | 40% | |
| *Dual-degree (MBA+MEM) program in design and operations. **Data based on 2Y and MMM entering class of 2021 and 1Y entering class of 2022. |
||
Northwestern University is an equal opportunity, affirmative action educator and employer.
Northwestern University does not discriminate or permit discrimination by any member of its community against any individual on the basis of race, color, religion, national origin, sex, sexual orientation, gender identity, gender expression, parental status, marital status, age, disability, citizenship or veteran status in matters of admissions, employment, housing or services, or in the educational programs or activities it operates.
Harassment – whether verbal, physical or visual – that is based on any of these characteristics is a form of discrimination. This includes harassing conduct affecting tangible job benefits, interfering unreasonably with an individual’s academic or work performance, or creating what a reasonable person would sense is an intimidating, hostile or offensive environment.
While Northwestern University is committed to the principles of free inquiry and free expression, discrimination and harassment identified in this policy are neither legally protected expression nor the proper exercise of academic freedom.
For advice or assistance regarding this policy, contact the Office of Equal Opportunity and Access, 720 University Place, Evanston, Illinois 60208-1145, 847-491-7458.
Northwestern University reserves the right to change without notice any statement in this publication concerning, but not restricted to, rules, policies, tuition fees, curricula and courses.
Geographic Representation of MBA Entrants
Geographic Region of MBA Entrants, Full-Time Class of 2023*
| International | 37.45% |
| Africa | 0.5% |
| Australia and Pacific Islands | 0.4% |
| Canada | 3.6% |
| Central and South Asia | 8.6% |
| East and Southeast Asia | 13.3% |
| Eastern Europe | 0.7% |
| Mexico, Caribbean and Latin America | 7.1% |
| Middle East | 0.8% |
| Western Europe | 2.4% |
| United States | 62.55% |
| Mid Atlantic | 5.8% |
| Midwest | 15.6% |
| Northeast | 15.3% |
| South | 8.1% |
| Southwest | 6.2% |
| West | 11.3% |
| U.S. Military Base | 0.4% |
| *Represents 2YMBA, MMM and MBAi entering class of 2021 and 1YMBA entering class of 2022. Data source: Matriculated data. Using Active address for geographic region. |
|
Major Employers
Company — Full-Time
Major Employers — Full-Time Class of 2023
| Companies Hiring three or more students1 2 | # Hired |
|---|---|
| Consulting | |
| AlixPartners | 5 |
| Alvarez & Marsal | 4 |
| Bain & Company | 30 |
| The Boston Consulting Group | 50 |
| Deloitte Consulting LLP | 8 |
| EY-Parthenon | 5 |
| L.E.K. Consulting | 3 |
| McKinsey & Company | 60 |
| PwC Strategy& | 6 |
| Consumer Packaged Goods | |
| General Mills | 3 |
| HelloFresh | 3 |
| Nike, Inc. | 4 |
| Procter & Gamble | 4 |
| Financial Services | |
| Alpine Investors III, LP | 9 |
| Evercore Partners | 4 |
| Goldman Sachs & Co. | 5 |
| Guggenheim Partners | 3 |
| Morgan Stanley | 3 |
| Partners Group | 4 |
| Robert W. Baird & Co. Incorporated | 4 |
| Healthcare | |
| Johnson & Johnson | 3 |
| Retail | |
| H&M | 3 |
| Technology | |
| Adobe Systems | 6 |
| Amazon | 23 |
| Apple Inc. | 4 |
| Experian | 3 |
| 8 | |
| Intuit Inc. | 3 |
| JMA Wireless | 3 |
| Microsoft Corporation | 6 |
| NVIDIA Corporation | 3 |
| TOTAL HIRES | 282 |
| 1Does not include sponsored students. 2Includes data from One-Year, Two-Year, MMM and MBAi graduates. |
|
Company — Internships
Major Employers of Summer Interns, Class of 2024
| Companies hiring three or more students1 2 | # Hired |
|---|---|
| Consulting | |
| AlixPartners | 3 |
| Bain & Company | 18 |
| The Boston Consulting Group | 57 |
| Deloitte Consulting LLP | 7 |
| EY-Parthenon | 7 |
| Kearney | 7 |
| L.E.K. Consulting | 8 |
| McKinsey & Company | 23 |
| Oliver Wyman | 4 |
| PwC Strategy& | 12 |
| Consumer Packaged Goods | |
| Kimberly-Clark Corporation | 4 |
| Nike, Inc. | 13 |
| Procter & Gamble | 3 |
| Financial Services | |
| Bank of America | 4 |
| Capital One Financial Corporation | 8 |
| Evercore Partners | 3 |
| Guggenheim Partners | 3 |
| J.P. Morgan | 3 |
| JPMorgan Chase & Co. | 6 |
| Robert W. Baird & Co. Incorporated | 6 |
| Healthcare | |
| Eli Lilly and Company | 3 |
| Genentech, Inc. | 3 |
| Johnson & Johnson | 6 |
| Manufacturing | |
| Cruise Automation | 3 |
| Cummins Inc. | 5 |
| Danaher Corporation | 3 |
| Emerson | 3 |
| Media / Entertainment | |
| TikTok Inc. | 3 |
| Retail | |
| Walmart, Inc. | 6 |
| Technology | |
| Adobe Systems | 16 |
| Amazon | 32 |
| Apple Inc. | 11 |
| 4 | |
| Intuit Inc. | 9 |
| Samsung Global Strategy Group | 3 |
| Uber | 4 |
| Western Digital Corporation | 3 |
| TOTAL HIRES | 316 |
| 1Data for sponsored students reporting summer internship details is included in this table. 2Includes data from Two-Year, MMM and MBAi summer interns of the Class of 2024 |
|